Demonstrating the Importance of Resource Loading in Substantiating Standing Time Claims
In this article:
- Resource loading
- Preconditions for any claim
- Updating records
- A case study
In my previous article I explained the benefits of having a resource loaded programme and why it is crucial to do so. In this article / case study, I would like to demonstrate and explain how resource loading can assist in substantiating a standing time claim.
The Significance of Resource Loading in a Program
I would like to start with this statement, If you don’t have a resource loaded programme you are going to find it very difficult to substantiate a standing time claim and that is purely because the client / owner will always ask you to prove that the resources, you are claiming standing time for are in fact evident in the baseline / accepted programme.
Preconditions for Any standing time claim
Condition president to any claim may it be a standing time claim or a claim for delay because of others is as follows but not limited to;
Identify Responsibility: Determine who is responsible for the event causing the delay.
Notify the Engineer/Client/Owner: Inform them through an early warning if the event is imminent, or via a compensation event notice if it has occurred.
- Mitigate the Delay:
- Can labourers be deployed to other work?
- Can plant and equipment be used elsewhere?
- This should be done with a level of caution because moving resources from one area / workface to another brings another dynamic into the equation and that is one of disruption, which is very difficult to prove in many instances. So, beware of just moving for the sake of moving.
Updating Contemporaneous Records
- Ensure contemporaneous records are updated
- Take photos, where possible
- Capture event in daily diary
- Capture event in schedule
- Suspend activity
- Split activity
- Ensure timesheets are available
- Ensure that you consider the effect the delay has on restarting the works and that it isn’t just an immediate start-up when in fact there is a sort of ramp-up time required to remobilise to the area.
- Ensure contemporaneous records are updated
Case Study
This case study involves the installation of an underground pipeline. There are two contractors, one a civil contractor and the other a mechanical piping contractor.
Planned Scope of Work
Figure 1 shows the planned scope of work. The rates for each resource, may it be labour or non-labour, are not in alignment with the actual rates of the respective resources and are purely for the purpose of demonstrating the calculation.
Fig. 1

Resource Loading Details
Figure 2 – 5 shows the resource loading for each activity in the programme. It should be noted that the resource loading has been done at crew level rather than individual level.
Fig. 2

Fig. 3

Fig. 4

Fig. 5

Resource loading: Crew and Rates
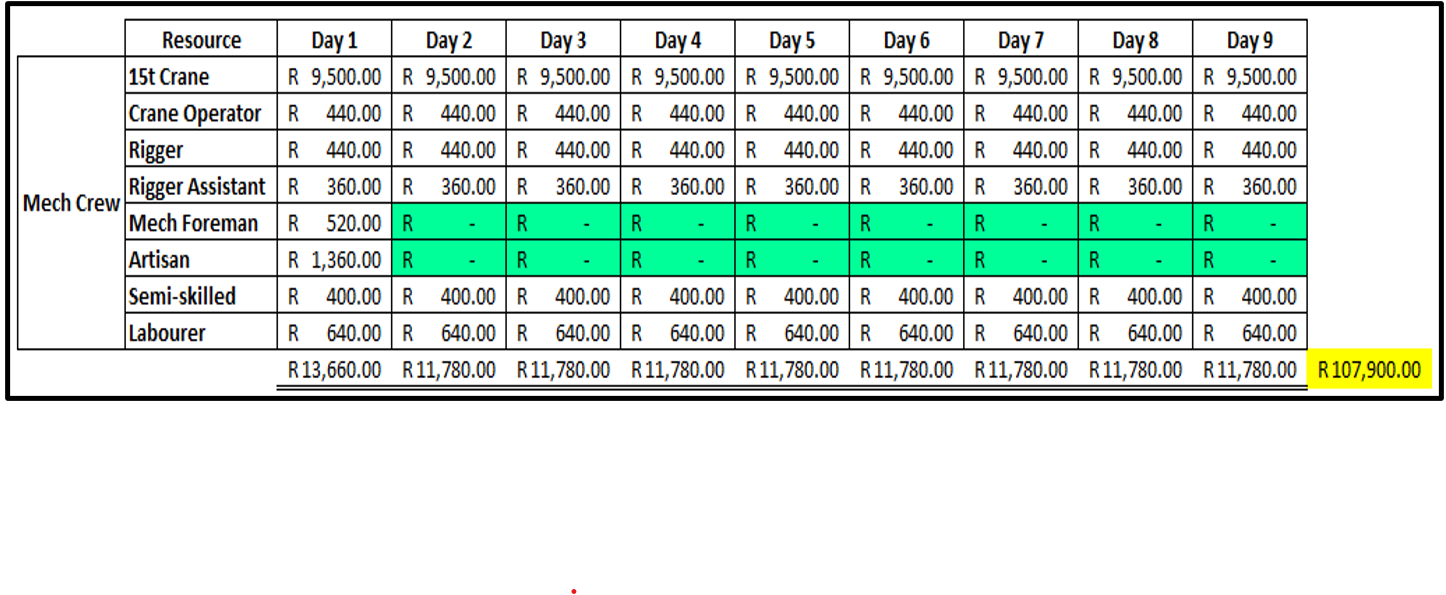
Figure 6 – 7 shows the makeup of the crews including the hourly and daily rates. The civil crew has a total daily rate of R11,900 per day, and the mechanical crew a daily rate of R13,660 per day.
Fig. 6

Fig. 7

Incident and Delay Analysis
Let us assume that all went according to plan and on the 20th of December the civil team came across an underground pipe that was not identified on the site survey report. As a result of this pipe the excavation works must be stopped.
Progress Overview
Figure 8 shows the progress of the work performed to date
Fig. 8

Notification and Timeline
As mentioned earlier, it is imperative that the client / owner gets notified as soon as practically possible, since this is what the contract normally calls for and what the contractor is obligated to do.
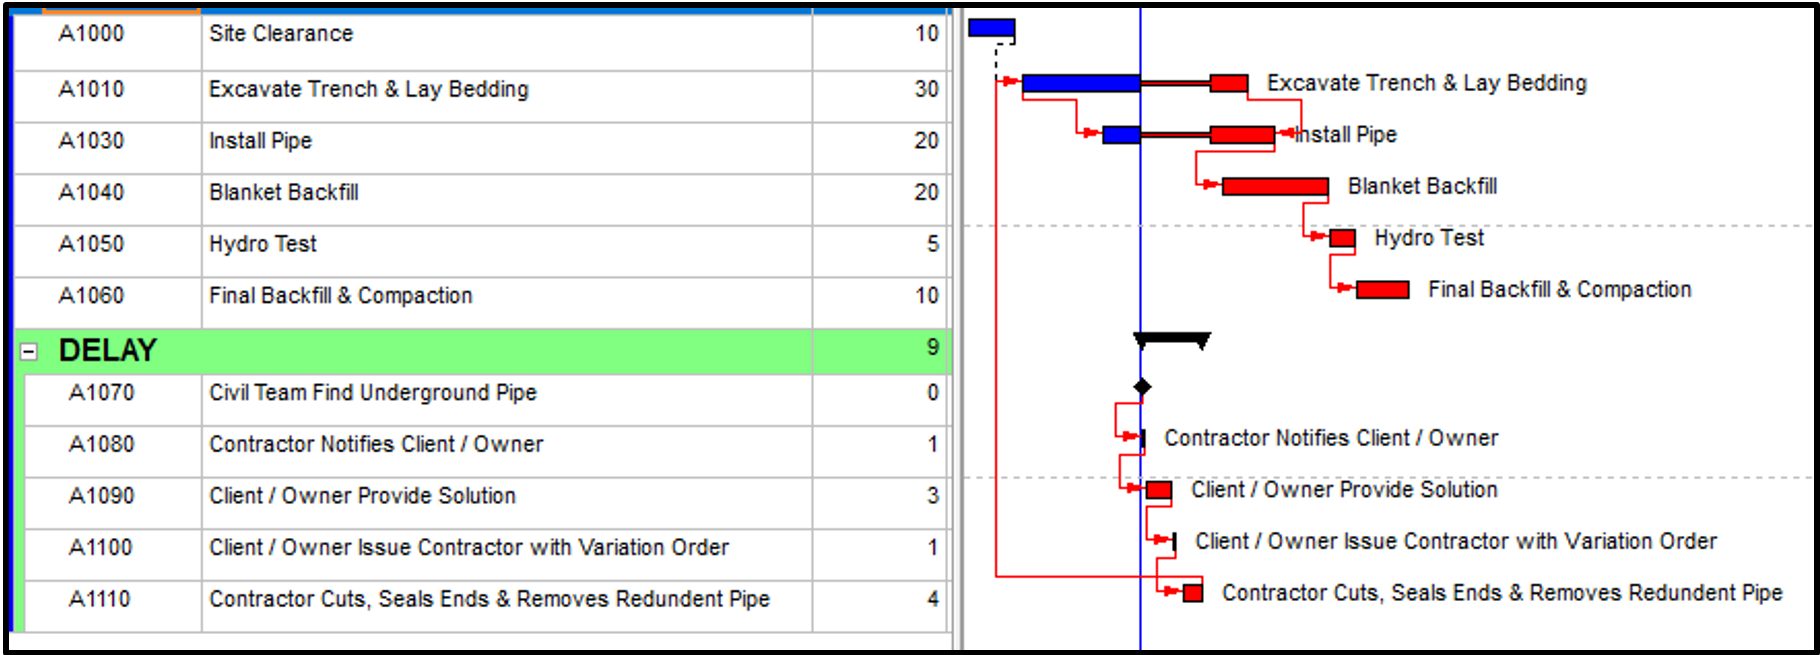
Figure 9 shows the fragnet of the events as they occurred from the event date.
Fig. 9

Impact of the Delay
Figure 10 shows the impact the delay event has / had on the remaining works. It is seen that the total delay amounted to 9 days of non-progress
Fig. 10
Cost Implications of standing time claims
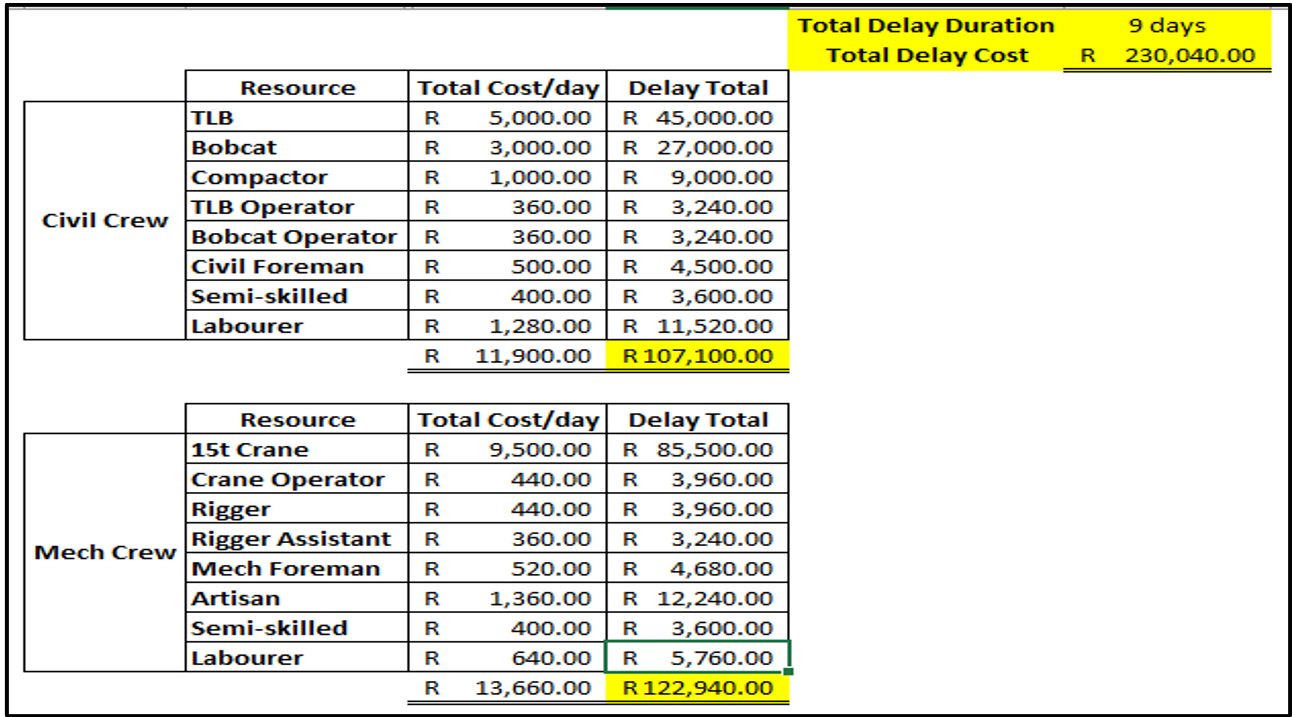
Figure 11 shows the total cost of the delay should the contractor not be able to mitigate this delay. The total delay cost for the 9 days of standing time would be R230,040. If the resources are loaded into the baseline programme, or you have loaded by crew but have resource tables to detail the crew make-up, then it makes it clear when it comes to calculating and substantiating your claims.
Fig. 11
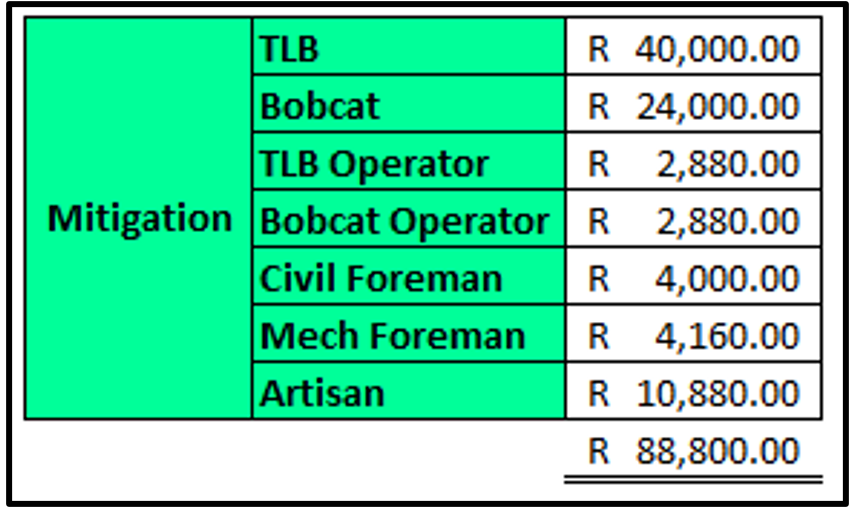
In this case study the contractor was able to mitigate some of the impact by moving some of the resources elsewhere for the duration of the standing time.
Cost Saved by Mitigating Impact
Figure 12 shows the cost that the contractor was able to save the client / owner.
Fig. 12
Final Cost Analysis
Figure 13 shows the total cost less the mitigation cost, and Figure 14 – 15 shows the spread of these costs. The green highlighted cells indicate the mitigation.
Fig. 13
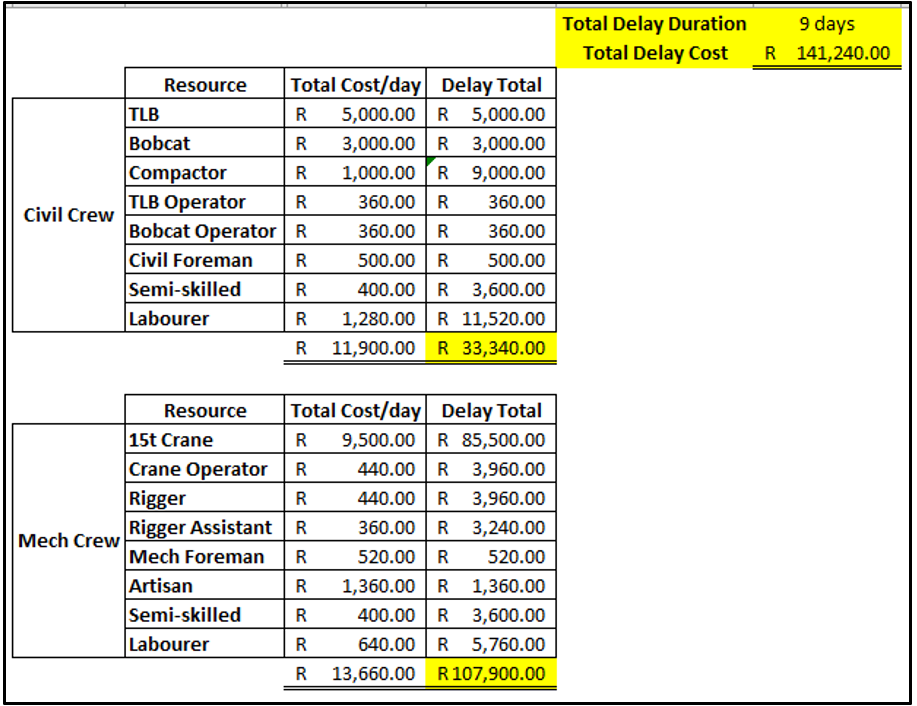
Fig. 14

Fig. 15
